
Last updated on June 1, 2021
Parallels RAS v16.1 | Performance Monitor
Performance Monitor
The Performance Monitor is a new feature introduced with Parallels® Remote Application Server (RAS) v16.1. This is aimed at providing the administrator with more in-depth information on how to improve the Parallels RAS infrastructure. The Performance Monitor reports are available both within the Console as well as via a browser.
What Is the Performance Monitor?
The Performance Monitor enables real-time access to historical and real-time stats on Parallels RAS infrastructure. These extensive reports provide IT administrators with insight into a wide range of key metrics, such as session information and CPU usage. By inspecting these reports, your organization can effortlessly enhance the performance of Parallels RAS and Windows Server components.
Why Should I Install the Performance Monitor?
All the Parallels RAS agents collect data on various metrics. This data is sent to an InfluxDB database for storage. Using this data, the Parallels RAS Console is able to create a visual representation of the different metrics (explained below), helping the administrator gain insight into how the infrastructure (both Parallels RAS and Windows server) RAS and Windows server, can be re-modelled.
What Are the Advantages?
Analyze resource usage, diagnose bottlenecks, map scalability needs, and help eliminate potential Parallels RAS misconfigurations, as well as keeping an eye on the general performance of the Parallels RAS environment.
What Types of Reports Are Included?
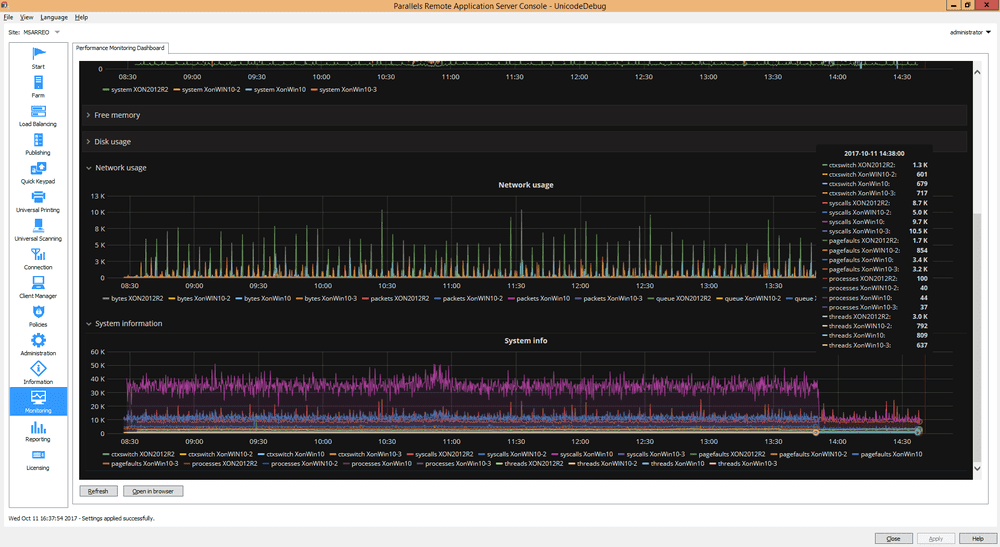
Performance metrics are displayed in the Performance Monitor as a graph. Different counters are displayed using different colors. The legend is displayed below the graph. There are six Performance Monitor reports:
- Session Information – Displays information about active and disconnected sessions
- CPU Usage – CPU counters
- Free Memory – Physical memory counters
- Disk Usage – Disk I/O counters
- Network Usage – Network interface I/O counters
- System Information – System information counters