


Parallels RAS Console:
A Remote Desktop Manager
The Parallels® RAS Console is a remote desktop manager for desktop and application delivery that enables administrators to easily configure and maintain a Parallels RAS farm infrastructure from a single pane of glass.
Centralized Management
IT can perform all the available tasks from the Parallels RAS Console, such as:
- Publish applications and desktops with virtual desktop infrastructure (VDI), Remote Desktop Session Host (RDSH) and Azure Virtual Desktop
- Monitor resources
- Manage connected devices
- Provide helpdesk assistance
- Define security policies
- Manage Azure Virtual Desktop
UX Evaluator and Advanced Session Management
The UX Evaluator provides an indicative and quantitative measure of the user experience by calculating the elapsed time between user interaction with published resources and corresponding response.
Administrators have a complete overview of user session details, improving service delivery. When users report anomalies, administrators or helpdesk can pinpoint issues faster and more accurately, providing a quicker root cause analysis (RCA). Administrators can proactively check user sessions and determine which users might need assistance.
Important metrics include:
- Login duration and logon duration breakdown
- Incoming and outgoing data within a session
- Bandwidth availability and usage
- Network latency
- User connection flow
- Number of reconnects and disconnect reasons
Multi-Tenancy Capability
The Parallels RAS Console enables IT to manage multiple customers (tenants) effortlessly. Share access layer components such as Secure Client Gateways and High Availability Load Balancers to maximize resource usage—while keeping customer data isolated and secure.
Granular Access Permissions
IT administrators can restrict access to sensitive resources based on user, group, MAC address, IP address and incoming gateway. With granular filtering, users are restricted from accessing certain data. IT administrators can add another layer of security with multifactor authentication (MFA).
Health Status of Components
The Site Info tab offers an interactive dashboard that provides an overview of the site components' status, quickly recognizable by colored boxes. A traffic-light color code (green, orange, and red) is configurable based on parameters such as CPU usage, users, and Parallels® Agent (PA) status. Visible at an individual or group level, the colored boxes provide an immediate understanding of the health of the site component.
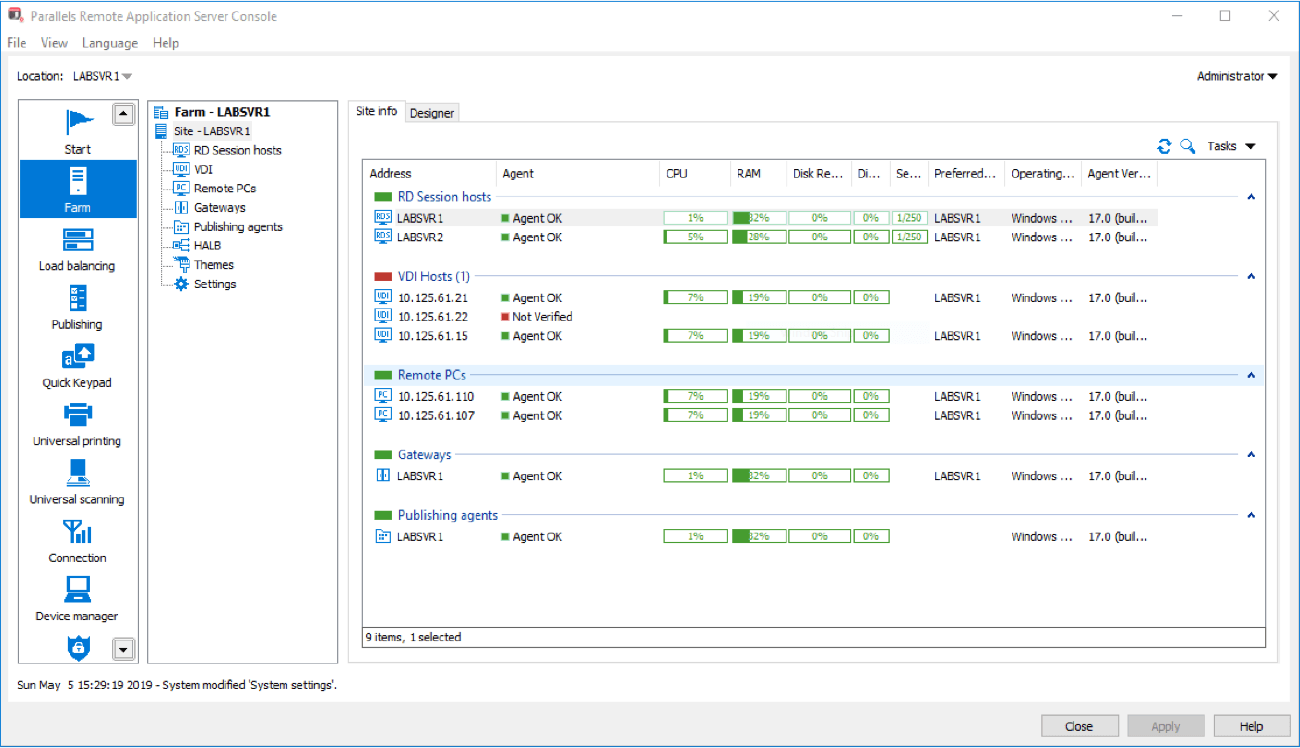
Settings Audit
Parallels RAS Console enables admins to revert and track changes made in the farm. IT admins can scroll through the settings audit and view any change made in the farm and revert it to a previous state. Filters may be applied to the list to make specific instances easier to find.
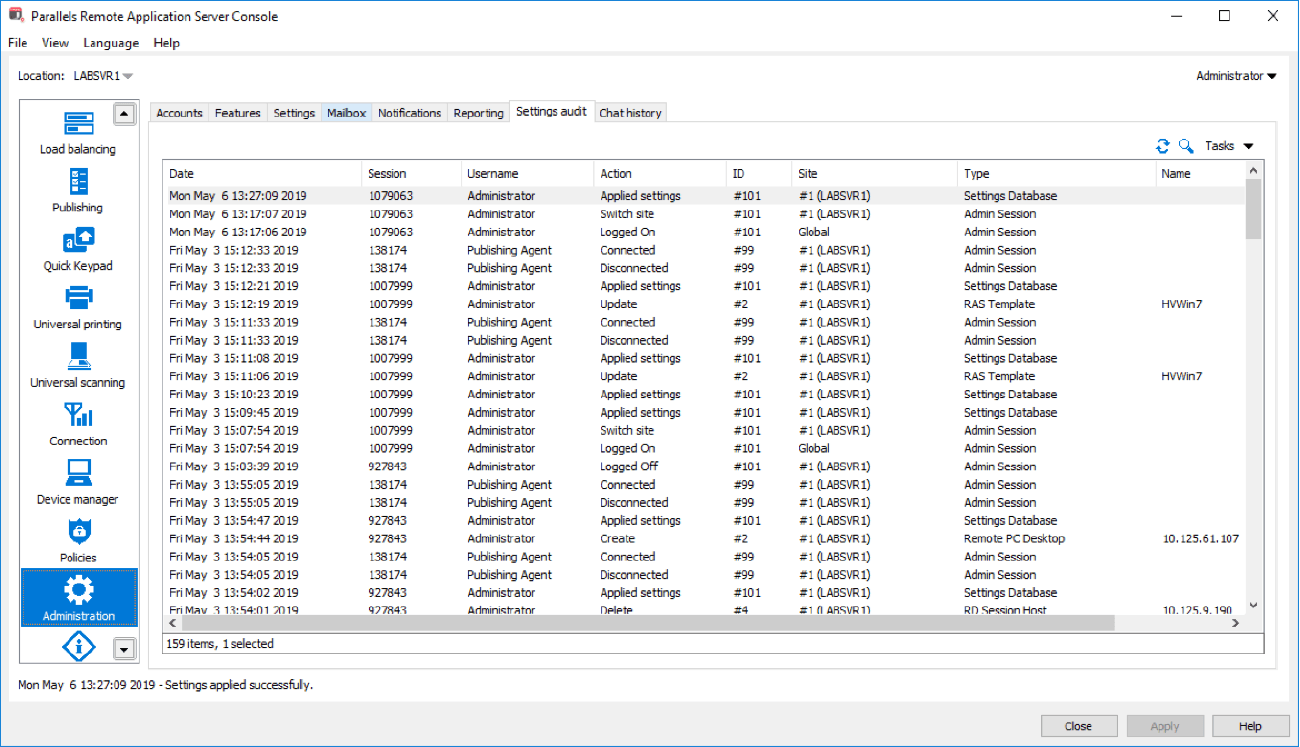
Enhanced System Notifications
IT administrators may set automated trigger notification messages according to performance counters—such as the grace period, CPU usage, and more. In addition, they can set self-executed custom scripts when a configured value is outside the predefined range.
Parallels RAS Console Server Tools
Parallels RAS enables instant access to a predefined set of management tools directly from the Parallels RAS Console, such as network utilities (Netstat/Telnet to and from hosts), Windows Service Management Console, reboot/shutdown actions, and much more.
Parallels RAS Template
IT administrators can make use of the Parallels RAS templates to automatically generate and deploy session hosts on the fly, creating on-demand virtual desktops or RD session hosts. Create a virtual desktop once and replicate it as many times as needed.
Device Management
Administrators can monitor the status and sessions of any connected Windows OS device, allowing for central management and power-cycle scheduling (on/off, reboot, and shutdown).
“Replace desktop” limits users from changing system settings or installing new applications. “Shadowing” enables admins to gain full access to a Windows desktop and control locally-running applications on the device.
Monitoring and Reporting
Monitoring server, desktop and application performance is critical to providing users with a seamless and productive UX. The Parallels RAS Reporting Engine transforms raw data into visual and intuitive reports, providing IT with an infrastructure overview. It creates detailed reports about the server usage, what devices are used, what applications are accessed and more.
Parallels RAS Management Portal
Parallels RAS offers a web-based Management Portal as an alternative to the traditional desktop console. It provides more flexibility, enabling IT administrators to perform daily tasks on the go.
From any device, including mobile, IT administrators may:
- Carry out configurations and day-to-day tasks without having to install the Parallels RAS Console
- Deploy Parallels RAS environments and publish RDSH-based applications and desktops
- Secure Parallels RAS environments with the addition of multi-factor authentication
- Manage Parallels RAS sitewide settings such as FSLogix Profile Containers and Universal Printing and Scanning
- Monitor user sessions from anywhere
- Manage Parallels RAS licensing
- Reach out to help and provide support resources directly from the Management Portal
Parallels will continue to add all the features available in the desktop console to the Management Portal in future releases.