


Enhance your Azure Virtual Desktop experience
Parallels RAS makes hybrid cloud easy
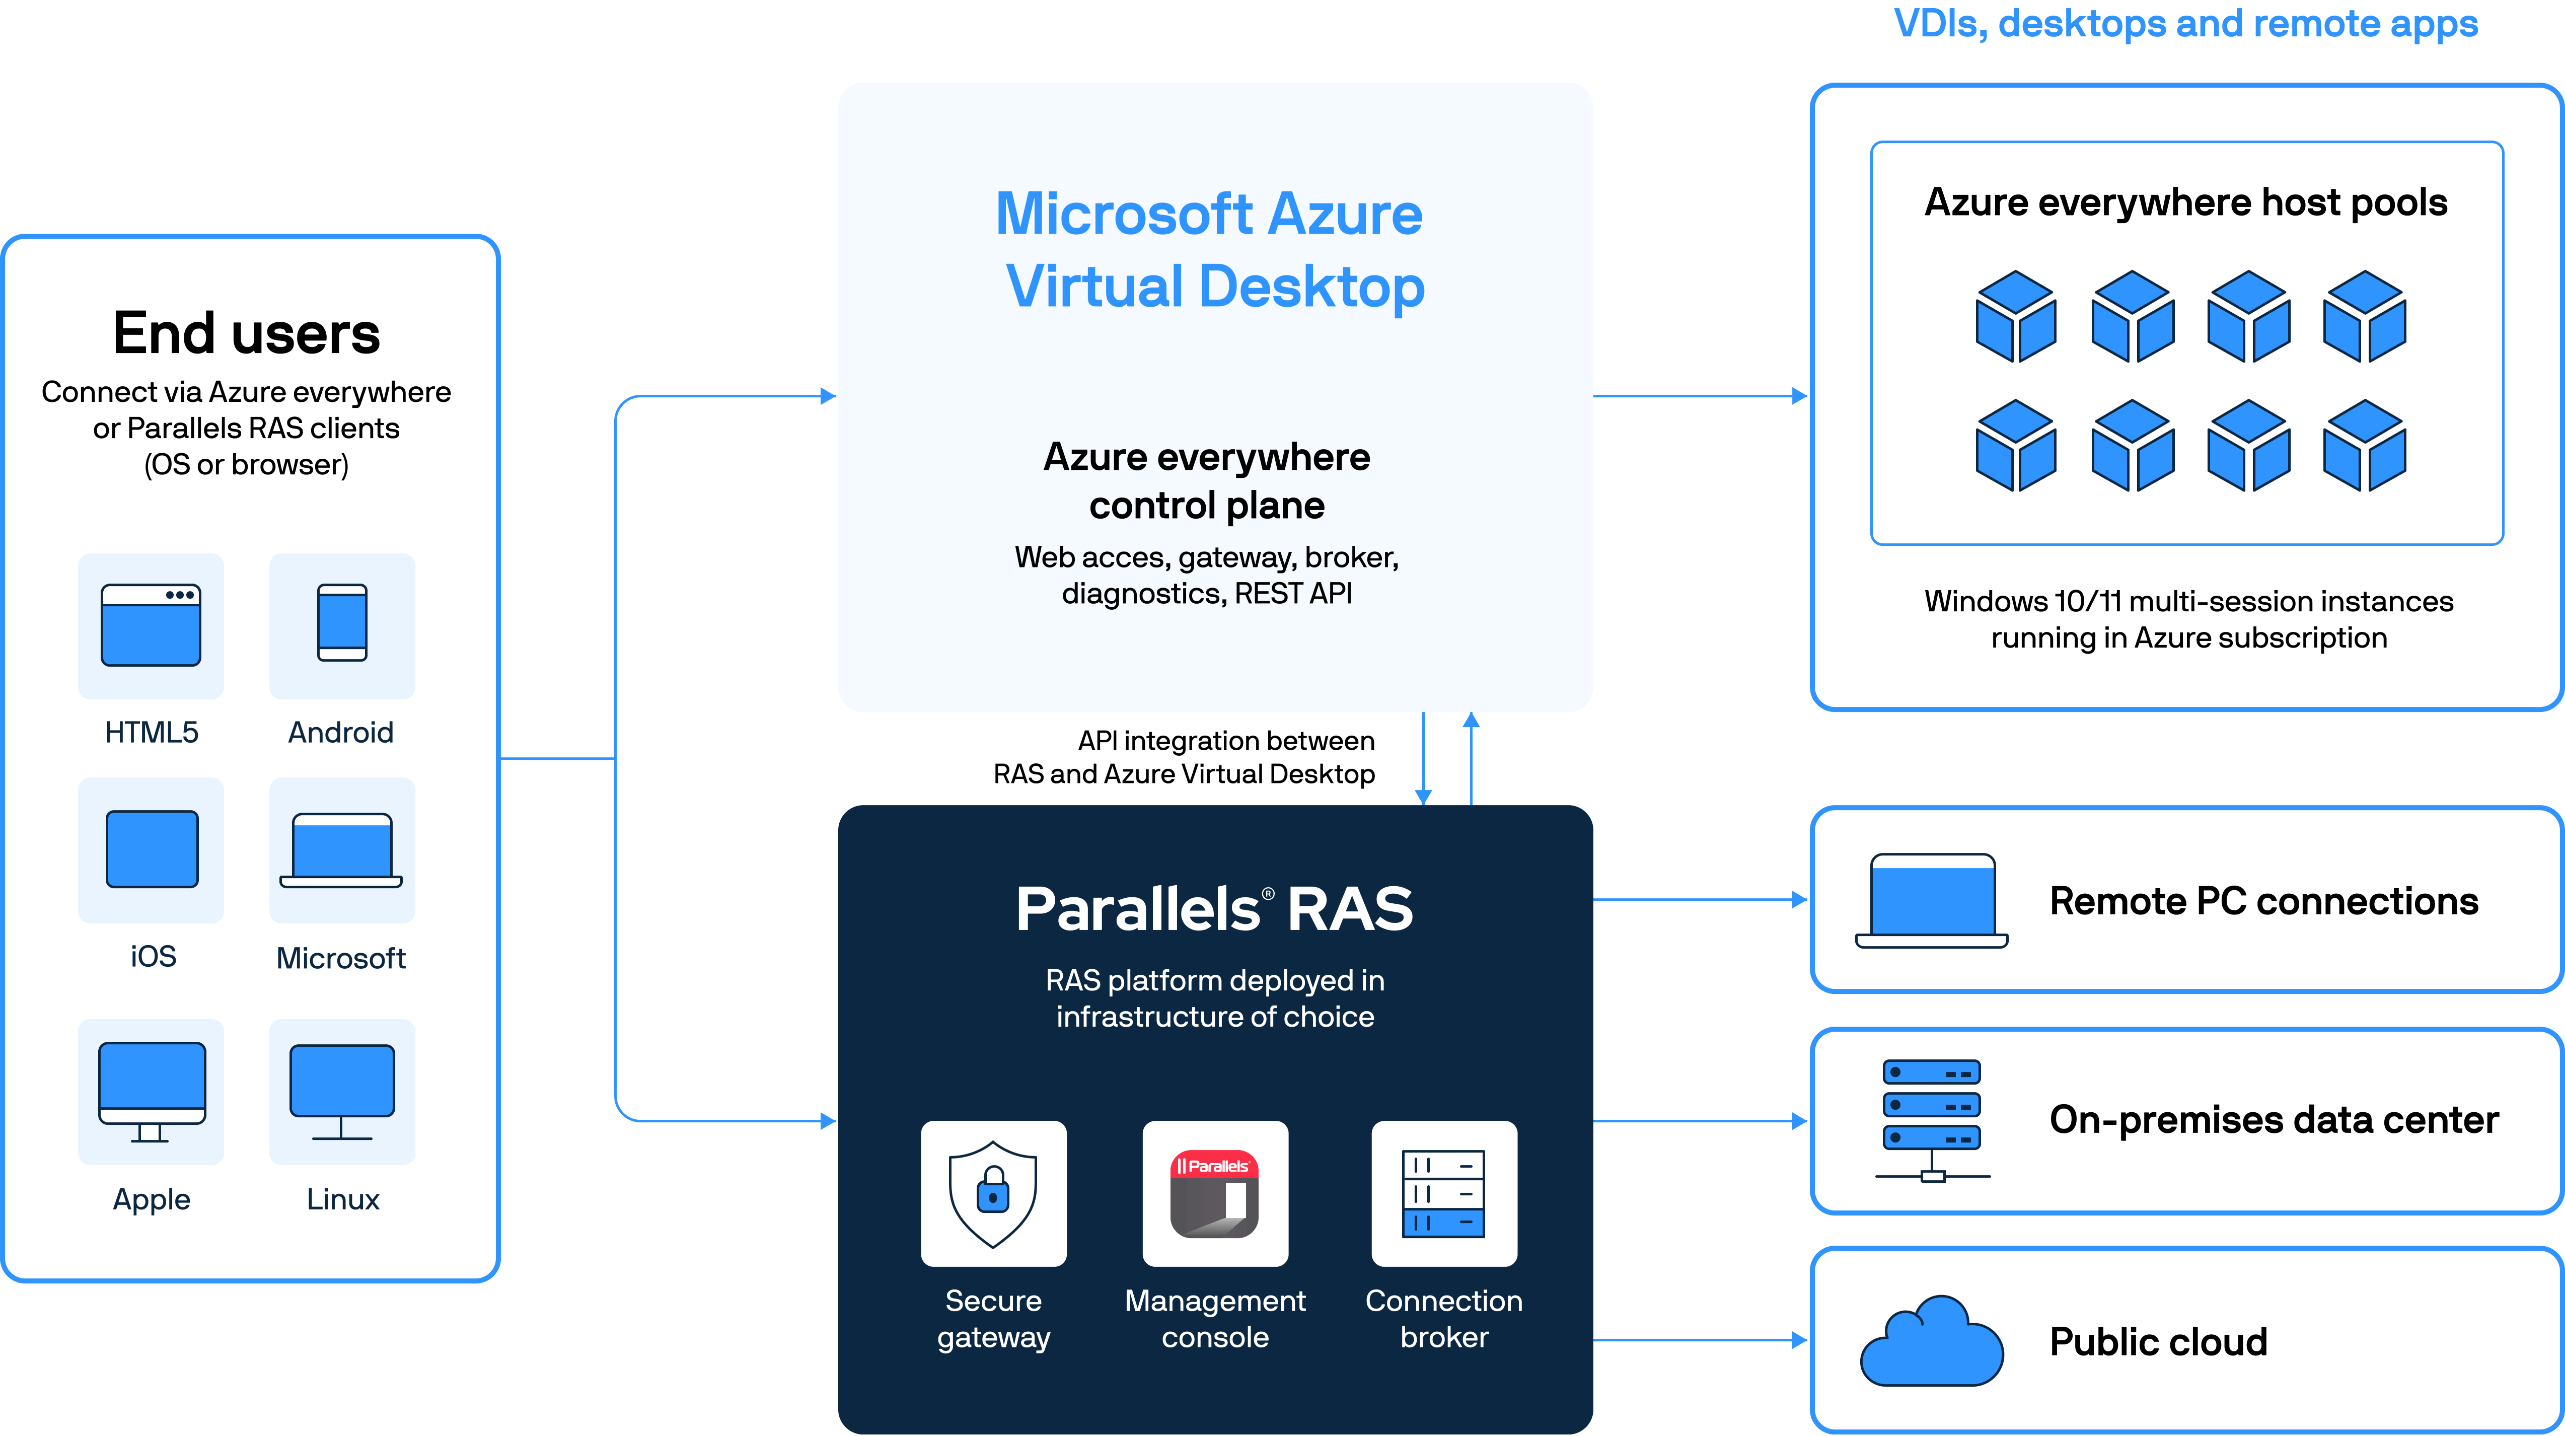
Parallels® Remote Application Server (RAS) seamlessly enhances Azure Virtual Desktop capabilities, offering organizations a consolidated approach to administration and user experiences. With Parallels RAS, organizations can effortlessly configure and optimize Azure Virtual Desktop alongside other resources, facilitating private, hybrid, or multi-cloud setups for enhanced flexibility and user efficiency.
Through the intuitive Parallels RAS Console, IT administrators gain centralized control, simplifying the provisioning and management of Azure Virtual Desktop workloads and component. From workspaces to host pools and application groups, every aspect is easily managed via intuitive wizards, providing a unified experience for administrators and users alike.
Better together:
Azure Virtual Desktop with Parallels RAS
Organizations using Azure Virtual Desktop can further enhance the experience with Parallels RAS in the following areas:
Hassle-free hybrid cloud deployments
Easily combine on-premises or other public clouds with AVD from the same console.
Organizations gain the freedom to choose their preferred infrastructure, supporting on-premises, cloud, multi-cloud, and hybrid deployments. It seamlessly integrates with Azure Virtual Desktop and heterogeneous Windows Server environments, providing a unified solution that enhances AVD capabilities while ensuring flexibility across diverse IT landscapes.
Reduce costs & optimize
Reduce Azure compute and storage consumption cost by ~ 54% -79%.*
Optimize Azure Virtual Desktop costs with Parallels RAS resource autoscaling by dynamically managing resource allocation. Implement automated power management to efficiently turn resources on or off based on demand and set up automated tasks for seamless resource management. Additionally, reduce storage costs by deallocating resources and managing storage usage during periods of inactivity.
Simplify deployment & management
Reduce time spent on maintenance and troubleshooting tasks by ~ 50-70%.**
Parallels RAS enhances the Azure Virtual Desktop advanced image optimization, integrated profile management tools, FSLogix profile and container integration, and wizard-based configuration guides. These features streamline management, improve performance, and ensure a consistent user experience.
Enhance user experience
Advance features to push the user experience beyond the native AVD.
Enhance end user productivity by offering a unified, user-friendly interface for seamless access to Azure Virtual Desktop and various resources. Moreover, leverage the advanced capabilities of Parallels RAS, including Universal Printing and scanning, AI-driven session prelaunch, and accelerated file redirection, to elevate the overall Azure Virtual Desktop experience.
Comparing Azure Virtual Desktop with Parallels RAS
Why Parallels RAS can help improve AVD offerings
| Features and functionality | Parallels RAS and Azure Virtual Desktop | Azure Virtual Desktop native |
|---|---|---|
| Auto scaling and power management of session host servers | ||
| Managing and maintaining FSLogix Profiles | (requires additional consoles and policies) |
|
| Image optimization to increase user density and performance | ||
| Drag and drop files to improve working with data | ||
| Universal printing and scanning | Limited | |
| Full hybrid options by deploying towards multi cloud and on premises | Limited (requires Azure Stack HCI) |
|
| Integrated cost savings on storage | ||
| Freedom of choice in MFA providers and IDPs | ||
| Accelerated file enumeration to speed up working with redirected drives | ||
| Managing and assigning MSIX app attach | Limited (no version tags, no automated certificate management) |
|
| Monitoring, reporting and session details | (requires Log Analytics at additional cost) |
|
| Managing multiple Azure Subscriptions / tenants | Limited | |
| Session prelaunch technology to speed up login process | ||
| Unified client consolidating AVD and non-AVD resources | ||
| Custom web access URLs including branding and simplified certificate management | (custom URL is possible but requires components and configuration outside of AVD) |
|
| Auditing of administrative actions with easy reverting of each action | Limited (no easy reverting of admin actions) |
|
| Granular filtering of published resources based on various conditions | Limited to only users and group membership |
|
| Wizard driven deployment, single console | Limited (requires multiple consoles and no end-to-end deployment wizard) |
|
| Automation based on API and PowerShell | ||
| 24x7 unlimited support included | (at additional cost) |
What customers and partners are saying about Parallels RAS
Azure Virtual Desktop and Parallels RAS Architecture
Download a full-featured 30-day trial today!
Try Parallels RAS on your existing infrastructure or in the cloud with Microsoft Azure or Amazon Web Services. Explore why Parallels RAS is a great Citrix alternative for businesses of all sizes.
Download trial1—Sourced from Parallels hybrid cloud survey.
2—Estimate based on reduced time to deploy, no more trial-and-error management, driven by intuitive and wizard-driven RAS management console (includes FSLogix configuration and MSIX app attach.)
3—Based on unoptimized AVD.