


Parallels® RAS

Parallels® RAS (remote application server) is a flexible virtual application and desktop delivery solution that empowers organizations of all sizes to work securely from anywhere, on any device.
Already a user? Download Parallels Client
What is Parallels RAS? Find out by watching this 90 second video.
Watch video
Why choose Parallels RAS
Flexibility
Deploy core components where best suited. Mix and match workloads: hybrid, on-premises, private cloud, public cloud including Azure Virtual Desktop and AWS.
User experience
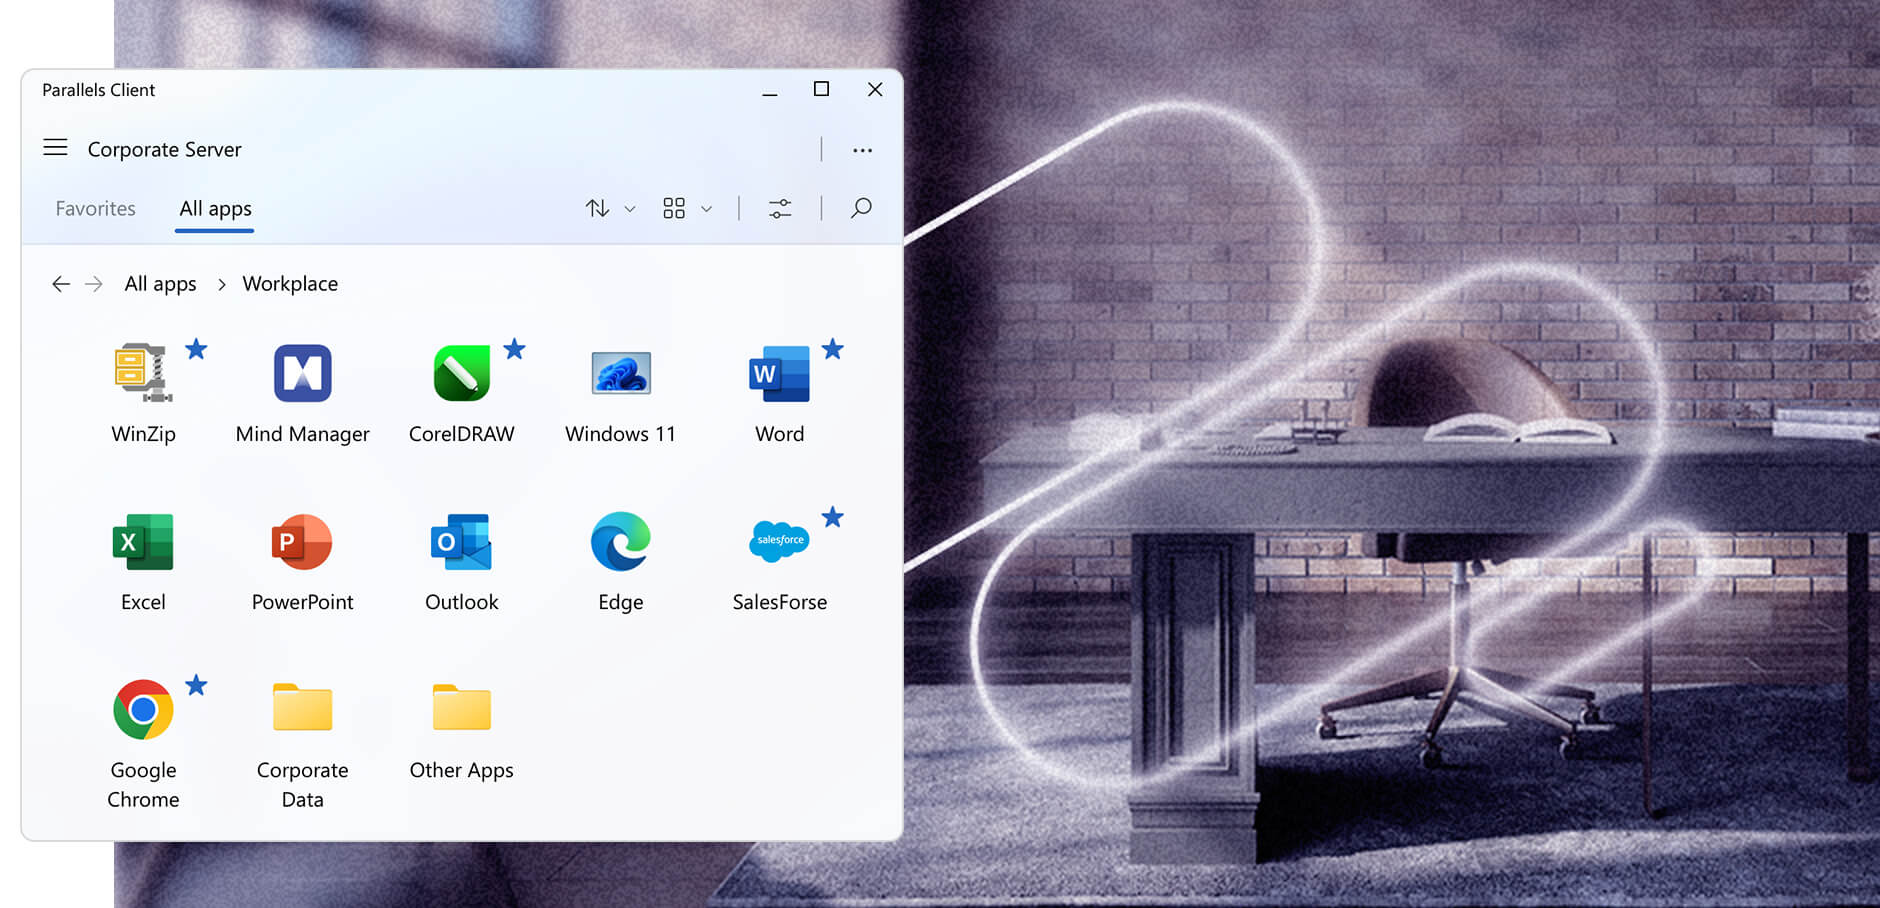
Parallels RAS enables end users with the flexibility to work and collaborate in any remote environment while using their chosen devices.
Simplicity
Empower users with a simple digital workspace. Just one console for administration. Straightforward deployment and management.
Enhanced security
Exceptional end-to-end security and compliance measures are built directly into the Parallels RAS code. This ensures confidence in deployment confidence, regardless of configuration.
Total cost of ownership
All-in-one solution, with fast and effective onboarding and deployment times. Includes 24/7 support, free technical training, and simple licensing, all of which combine to help reduce costs.
What companies do with Parallels RAS worldwide
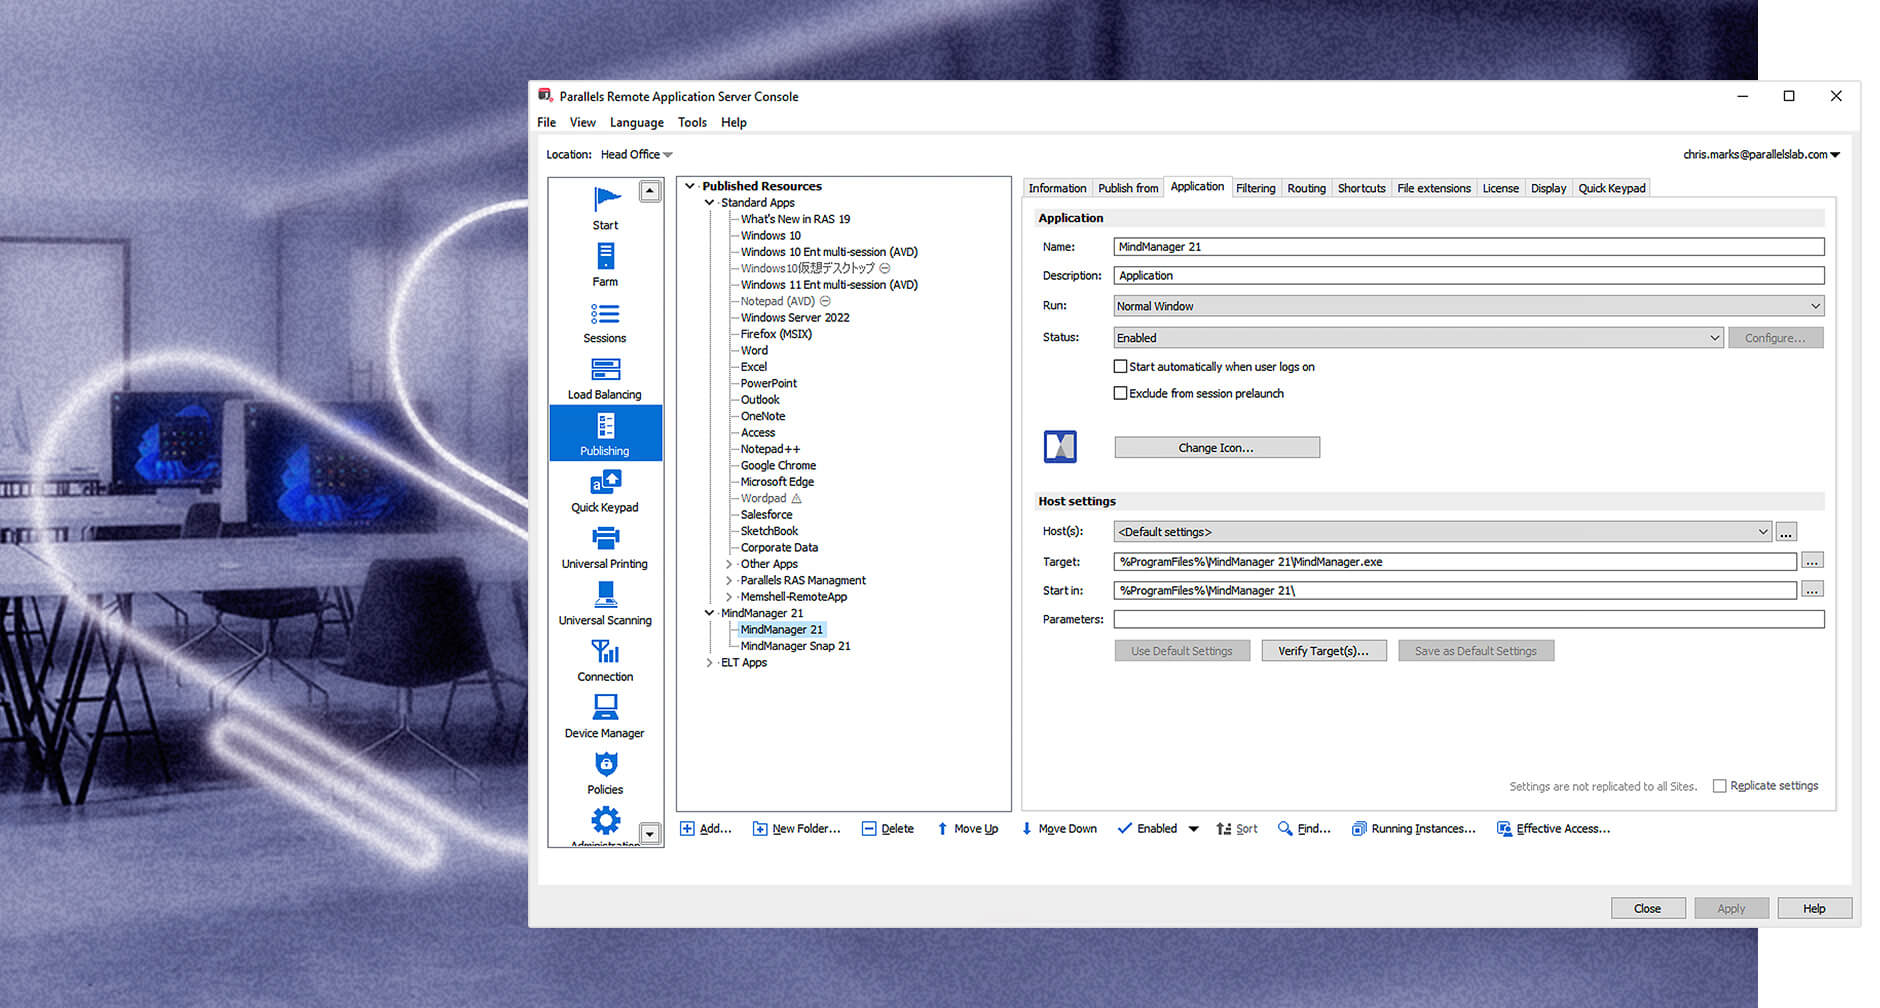
Application publishing
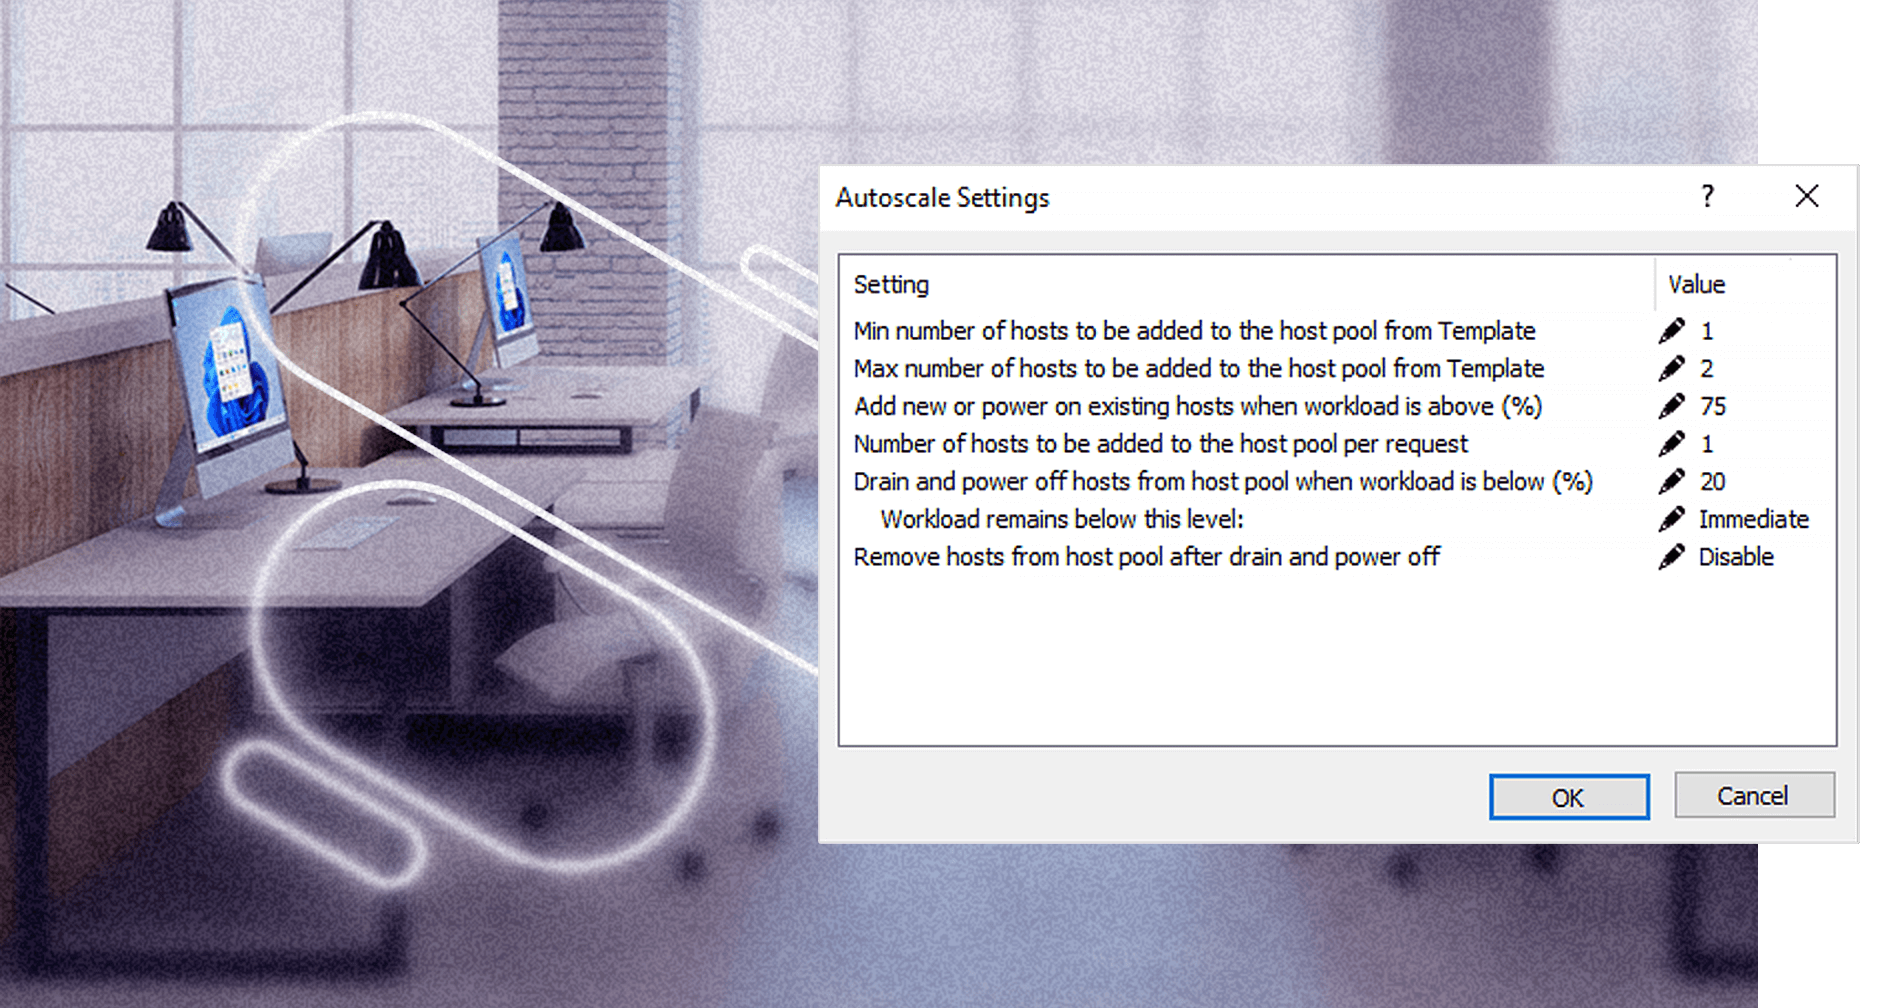
Hybrid DaaS/VDI
Remote to any device
Multi-tenant deployment
High availability load balancing
Reporting and monitoring
Discover the capabilities of Parallels RAS
Flexible solution with extensive integration options
Unparalleled user experience
Simplified IT administration
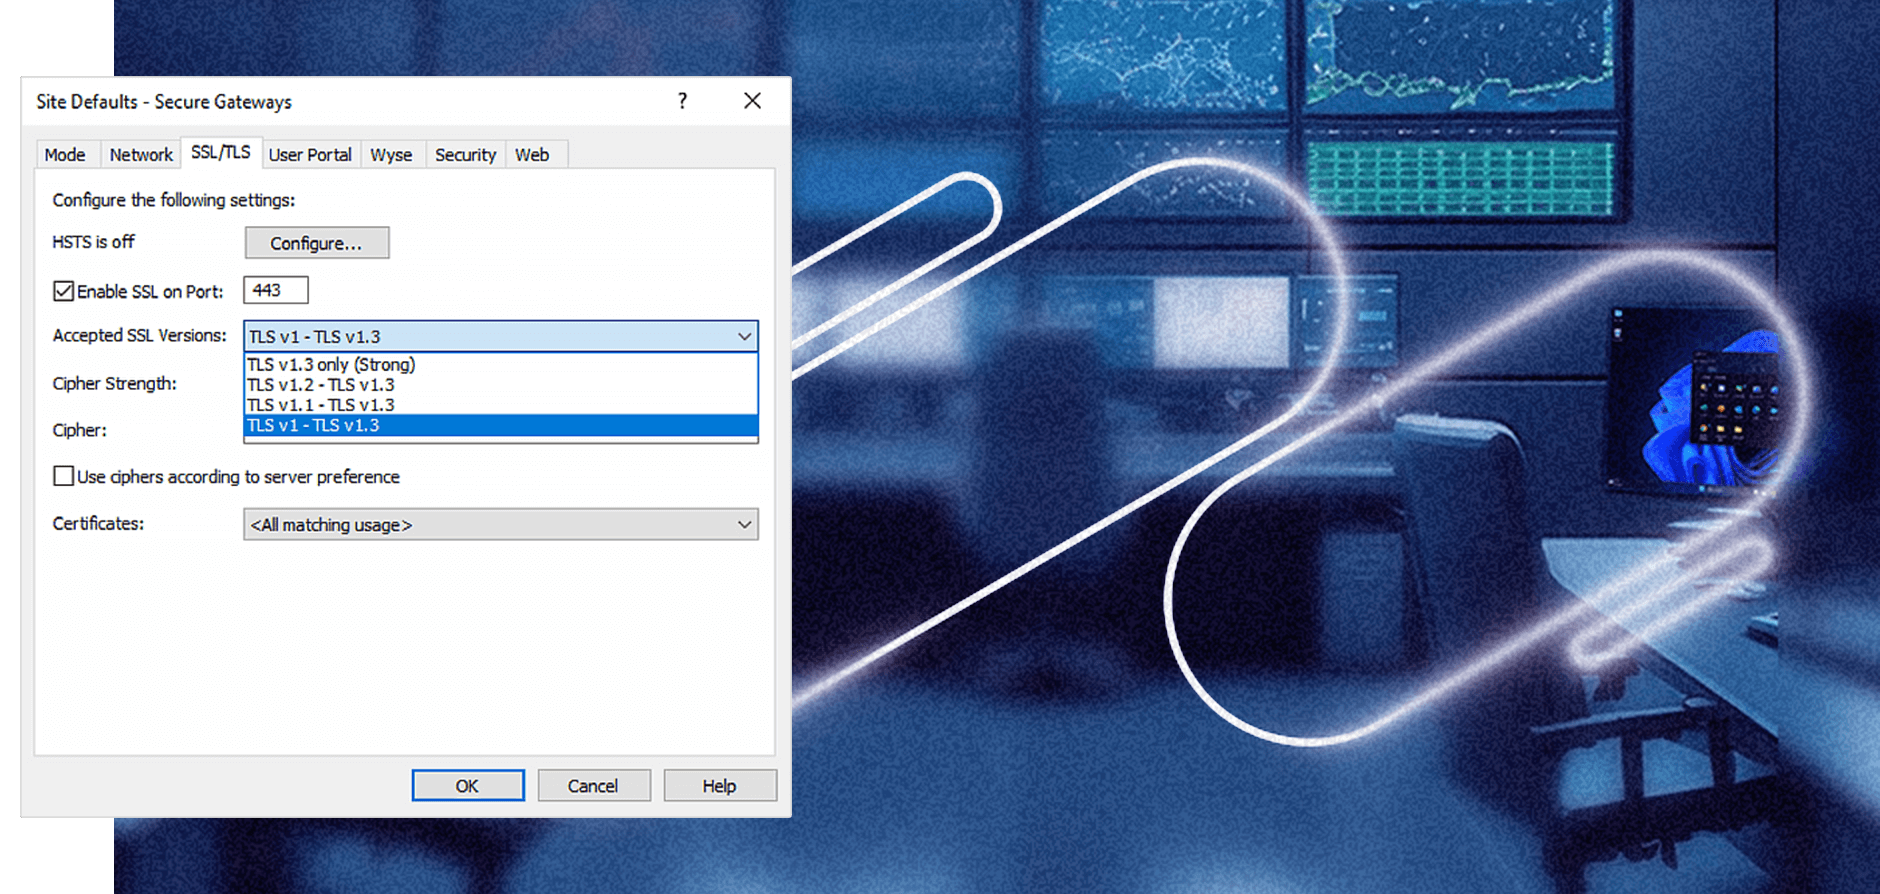
Upleveled security and compliance
Superior Total cost of ownership (TCO)
Discover how Parallels RAS is being used in industries like yours
What customers are saying about Parallels® RAS
Parallels Tech Bytes - Parallels RAS
Learn about Parallels RAS features and capabilities with our short how-to and feature highlight video series!

Are you ready to try Parallels RAS?
Try nowAre you a Parallels RAS partner? Visit the Partner Portal.
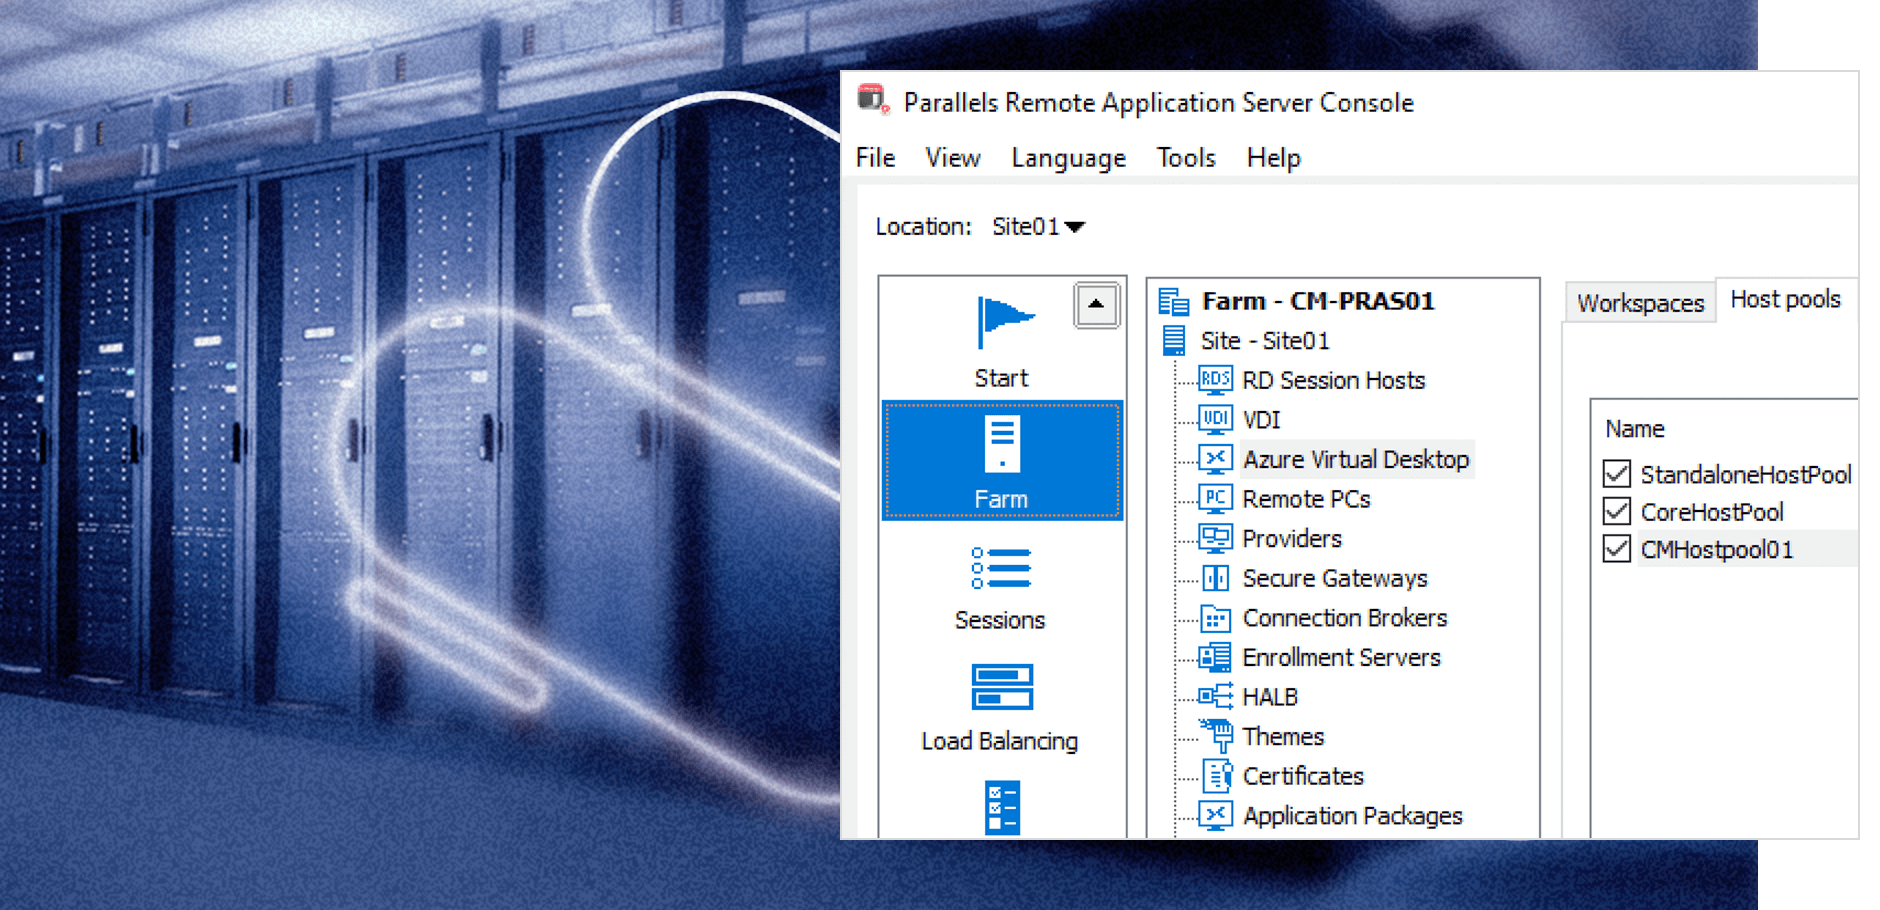
Scalable, flexible architecture
What is Parallels RAS, and what are the key elements of its fundamental architecture setup? Additionally, what are the basic steps for deploying Parallels RAS?

Benefits of Parallels RAS architecture
- Easy to setup, manage, and maintain from single management console
- All-encompassing solution that provides strong TCO
- Freedom of choice and flexibility for deploying core components and workloads
- Built-in high-availability and scalability
- Simplified secure remote access
- Intuitive access for users from any device, anywhere
Building better solutions, together
Parallels has partnered with an extended network of renowned technology partners for over two decades to deliver the best solutions on the market.

Simple licensing. No hidden fees.
Talk to one of our experts to discuss solutions, schedule a demo, or request a quote.
We’re here to help.
All subscriptions come with 24/7 remote support.
Frequently asked questions
It can integrate with all major hypervisors (VMware ESX, Microsoft Hyper-V, Scale, Nutanix, or other popular options) as well as Cloud service providers like Microsoft Azure, Azure Virtual Desktop and Amazon Web Services EC2.
Parallels RAS is a virtual application and desktop delivery solution that centralizes applications and desktops on a server or cloud infrastructure, allowing users to securely access them from various devices. It offers robust user authentication, load balancing, and encryption for data security, providing a seamless and responsive remote access experience. Administrators can efficiently manage access, monitor performance, and ensure compliance, making Parallels RAS a versatile tool for organizations seeking to provide remote access to their Windows applications and desktops.
Parallels RAS costs per concurrent license user, with a minimum of 15 concurrent users.
We provide phone, email and remote support 24 hours a day, 7 days a week, 365 days a year. Our global support staff have years of experience supporting virtual infrastructure products in real-world customer environments. We are committed to delivering the best support service experience.
- Global support, no regional boundaries.
- Unlimited number of support requests.
- Fast response times for critical issues.
- Online access to documentation and technical resources, knowledge base articles, and forums on our Support page.
- Phone and email support in English or using automatic translation tools.
- Products supported as per Lifecycle Announcement.
Parallels®’ RAS single license model provides access to all capabilities, providing enterprise-range features such as application and desktop delivery with remote PC, RDSH and VDI, load balancing, multi-cloud ready, monitoring and reporting, FIPS 140-2 encryptions, and 24/7 customer support. It includes online licensing management, access to knowledge base and training materials.
As an all-in-one solution, Parallels RAS eliminates the complexity of evaluating which license best suits your business needs today and your future expansion plans.
Parallels RAS uses concurrent-user licensing. Under this licensing model, Parallels RAS only counts the total number of users who connect to it at the same time. Any number of such connections to Parallels RAS can occur as long as the number of users simultaneously accessing Parallels RAS does not exceed the number of available licenses. Concurrent licensing is easier to administer as IT departments do not have to monitor usage as closely in comparison to named-user licensing. An entire team can be empowered with only the number of licenses that are expected to be in use simultaneously—they will not require a license for every user as is the case with named users. So, for example, an organization that has 200 employees who work two different shifts may opt to buy 100 licenses for all those employees. This means that all 200 employees will have access to Parallels RAS as concurrent users, such that 100 of them can connect during the first shift and the other 100 can connect during the second shift.
Licensing Parallels RAS with a prepaid subscription allows you to upgrade to a newer version whenever one is released.
- A subscription is purchased for a predefined period of time: either one year, two years, or three years.
- If a subscription is purchased online, it can be set to automatically renew when the subscription period ends by default.
- Subscriptions purchased through a reseller must be renewed through the reseller.
- Support is included in the cost of the subscription.
The Parallels RAS SPLA model is targeted to Managed Service Providers (MSPs) and Independent Software Vendors (ISVs) who are already part of the Microsoft Service Provider License Agreement (SPLA) Program.
- It is licensed per peak number of concurrent users over a billing period.
- The data is automatically collected on a daily basis from each farm and is used to calculate the licensing cost at the end of a billing cycle.
- There are no upfront costs - you pay for licenses as you go, based on what you make available to your customers each billing period.
- When using SPLA you can activate multiple farms using a single license key, and track usage history for each farm in Parallels My Account.
- Access to latest product updates, knowledge base, training materials, and the 24/7 customer support line.
By supporting sublicensing, Parallels RAS allows organizations to manage multiple independent keys while retaining centralized consumption information. Sublicenses allow an organization/service provider, for example, to provide company subsidiaries/customers with a Parallels RAS license for the number of users needed, and the license can be managed at any time. You can also use a sublicense for the activation of a test farm. A sublicense has its own license key used for activation and its own expiration date.